Gordon Moyer
THE CHANGE IN A STAR'S DECLINATION DUE TO LUNISOLAR PRECESSION

__
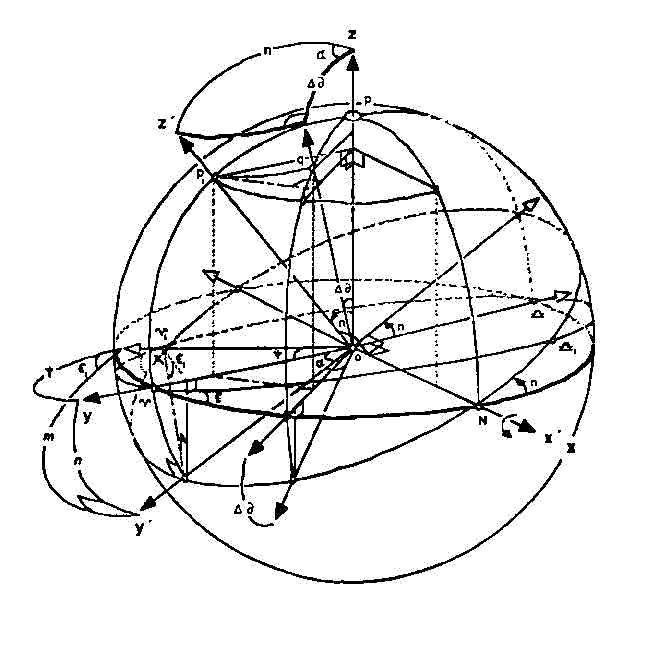
At first sight, my diagram may appear to be the work
of a fevered mind, but it is an accurate depiction of the complex geometry
underlying the precession of the equinoxes. Simply put, precession is
the wobbling of the Earth's axis, which takes place over many thousands
of years.
Our planet's axis of rotation does not always
point to the North Star; it slowly alters direction in space, much like
the handle on a spinning, wobbling top. This alteration in direction brings
about changes in the coordinates of fixed celestial bodies such as stars.
Declination is the name of one such coordinate in the sky.
Although many textbooks in positional astronomy
provide formulas for calculating the change in coordinates due to precession,
not a single one I've found shows in much detail the geometry behind these
changes. This then may be the first comprehensive illustration showing
how the declination of a fixed star changes as a result of precession,
specifically that part of precession caused by the combined pull of the
Sun and Moon on the Earth.
After obtaining a stack pass to Deck 9-North of
The Library of Congress, I sifted through one of the largest collections
of astronomical texts in existence, searching for the kind of diagram
I finally had to make myself. I did it quite a few years ago, on an old
512K Macintosh using very unsophisticated software. It took me about three
weeks to finesse all the lines and labels into place.
Is my diagram perhaps too detailed? Very
likely. Just as in a computer program, in a technical drawing, information
takes up room. I could have left out numerous elements in the diagram,
but having been enormously peeved by the sketchy graphics in so many math
and science books, I set out to see how much data I could overlay in one
diagram. I will always err on the side of excess rather than leave out
visual clues that could help explain why an equation works.
I regard geometry as a very visual subject, which
algebra reduces to a kind of language, to a shorthand and summary
of the essentially pictorial. In order to really appreciate algebra, we
must get behind the symbols to the geometric facts which algebra proves
and describes—Omar Khayyam said as much nine hundred years ago.
I hope to reclaim what is visual in math, namely the geometry behind algebra.
I say that a geometric drawing is worth a thousand algebras!
Often it has been said that "mathematics
is the language of science." That has too long been the
analogy, and a false one. Mathematics is far more a picture than
a language. I would rather say that "algebra is a language describing
geometry, a picture." We might think of it this way: the words "a
skylark soars over a wheatfield" is an algebra—the shorthand
and summary of a geometry, van Gogh's Field With Lark.
The great Enlightenment astronomer and mathematician
J. L. Lagrange actually prided himself in using no illustrations in his
texts. This anti-pictoral bias has been adopted by mathematicians ever
since. Today, you can't find a book on, say, Hilbert Space or vector calculus
which contains good visualizations—I mean illustrations that actually
link the algebraic equations to the geometry. This makes learning what
is going on "behind the equations" unduly difficult.
I believe that mathematics, far from being
a highly conceptual field, is really as visual a subject as art history.
