Eliyahu M. Goldratt, What is this thing called THEORY OF CONSTRAINTS and how should it be implemented, North River Press, 1990.
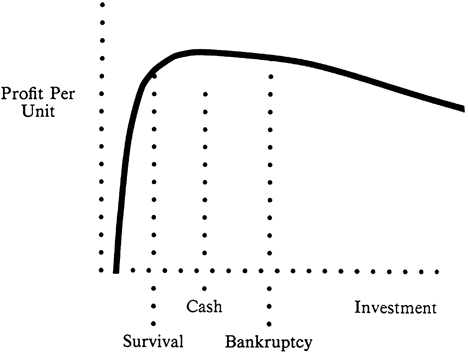
How do we bring investment into the picture? We should just remind ourselves of the reason for the linear relationship (straight line) between carrying cost and the batch size. Doubling the batch size means doubling the carrying cost. But this implies doubling the investment in the work in process and finished goods material that we hold. In other words, there is also a linear relationship between the batch size and investment. Thus we can simply replace the horizontal axis (batch size) with investiment (in WIP and FG's) and we get a graph which is profit per unit versus investment, as shown in Figure 6:
